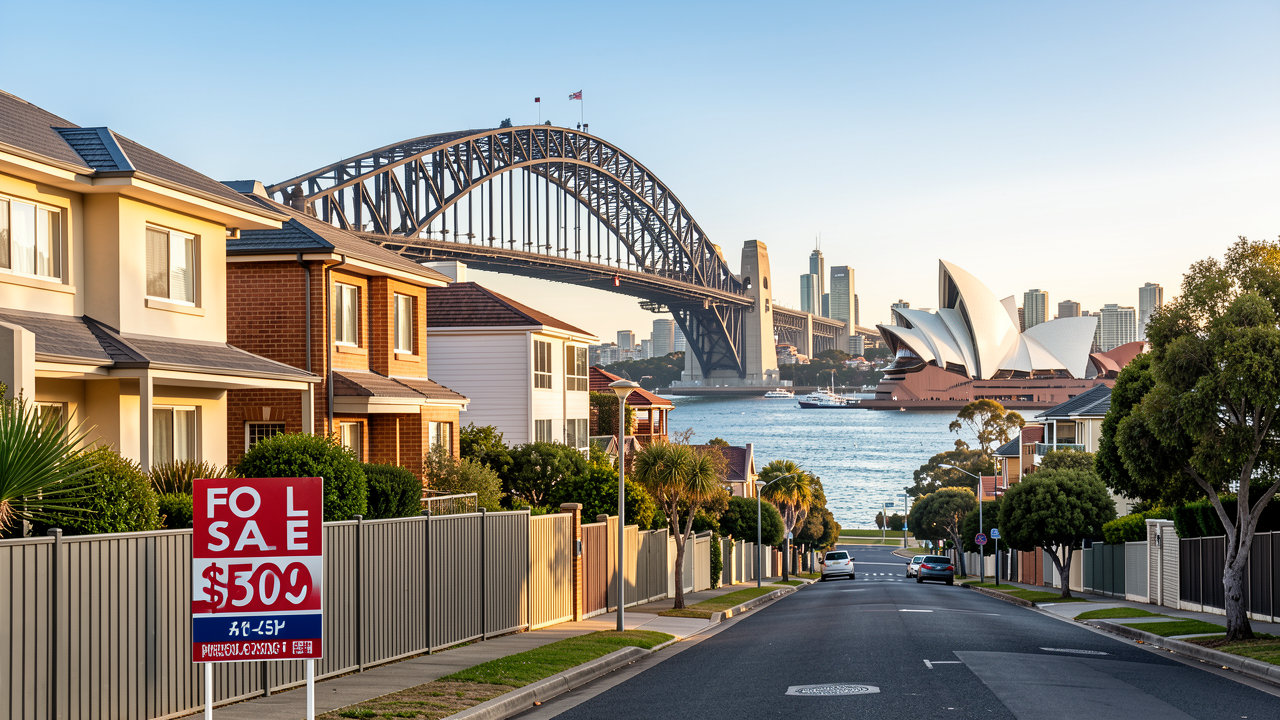
The short answer: Sydney's median residential property value reached approximately A$1.19 million in December 2024, making it Australia's most expensive capital city. House prices have risen roughly 8,000% since 1970, though inflation-adjusted growth tells a more nuanced story about long-term affordability and investment returns. For many first-home buyers priced out of Sydney's market, rentvesting offers a way to enter the property ladder by buying in more affordable markets while continuing to rent where they want to live.
The sydney australia average house price is one of the most searched property queries in the country, and for good reason. Whether you're a first-home buyer trying to understand what you can afford, an investor assessing capital growth potential, or a homeowner tracking your equity position, knowing the current market price is essential. But here's the challenge: different sources report different numbers, and the term "average" itself can be misleading. Is it a median sale price? A dwelling value index? Houses only, or all property types? This article cuts through the confusion. You'll see the latest figures from major data providers, understand why the numbers vary, learn how Sydney compares with other Australian capitals, and discover what these prices mean for your next move.
What Is the Current Sydney Australia Average House Price?
Sydney's property market uses several metrics to describe pricing, and understanding the distinction matters. The
median house price reflects the middle point of all house sales in a given period, half sold for more, half for less. The
median dwelling value includes houses, units, townhouses, and apartments in a single index. CoreLogic reported Sydney's median dwelling value at approximately
$1.19 million in December 2024, the highest among Australian capital cities, according to Statista. Domain's September 2025 House Price Report showed the median house price (detached homes only) at approximately
$1.35 million, while the median unit price sat around
$780,000. These figures are not contradictory, they measure different segments of the same market.
Houses Versus Units: Why the Gap Matters
The price gap between Sydney houses and units has widened considerably over the past decade. Detached houses have consistently outperformed apartments in capital growth, driven by land scarcity, zoning restrictions, and buyer preference for space. A house in Sydney's median price range typically sits on a 400-600 square metre block in middle-ring suburbs like Strathfield, Epping, or Ryde. A unit at the median price point might be a two-bedroom apartment in Parramatta, Chatswood, or inner-west precincts. For investors, this distinction shapes strategy. Houses deliver stronger long-term growth but lower rental yields (typically 2.5-3.5%). Units generate higher yields (3.5-5%) but face oversupply risks in some precincts. The sydney australia average house price reflects detached homes specifically, not the blended dwelling index that includes apartments.
How Data Providers Calculate Sydney Prices
CoreLogic uses a
hedonic regression model that adjusts for property characteristics (land size, bedrooms, location) to produce a daily value index. Domain and REA Group report
median sale prices based on actual settled transactions, updated quarterly. The Australian Bureau of Statistics (ABS) publishes a
residential property price index that tracks price changes over time but does not report a dollar median. Each methodology has strengths: CoreLogic's index smooths volatility and updates frequently, while Domain's transaction medians reflect real market activity. When comparing the sydney australia average house price across sources, check the date, the property type (houses versus all dwellings), and whether the figure is a median or a modelled value. A $150,000 difference between sources is often just methodology, not market movement.
How Has the Sydney Australia Average House Price Changed Over Time?
Sydney's property market has delivered extraordinary nominal growth over the past five decades, but the inflation-adjusted story reveals important nuances. A Reddit analysis in r/AusProperty calculated that Sydney house prices increased approximately
8,000% from 1970 to 2025, representing an annual return of roughly
8.37%. Over the same period, cumulative inflation was approximately
1,400%, meaning real (inflation-adjusted) prices rose about
5.7 times. That's meaningful wealth creation, but it's not the exponential windfall the nominal percentage suggests. The analysis also found that a major portion of the long-term increase occurred between
1970 and 1980, when prices roughly quadrupled, a period of high inflation, rapid population growth, and limited housing supply.
The 1970-2025 Growth Trajectory
Breaking down the 55-year period into phases shows how market cycles shape long-term returns. The 1970s boom was followed by stagnation in the early 1980s as interest rates spiked above 17%. The late 1980s saw another surge, then the early 1990s recession. The 2000-2003 period delivered strong growth, followed by relative stability until the 2012-2017 boom that pushed Sydney's median house price past $1 million for the first time. The 2017-2019 correction saw prices fall 15% before rebounding through the pandemic-era surge of 2020-2021. By 2026, the sydney australia average house price had stabilised after two years of modest growth. The long-run annual return of 8.37% sounds attractive, but it masks meaningful volatility within shorter holding periods. Investors who bought in 1988 or 2017 faced years of flat or negative returns before eventual recovery.
Real Versus Nominal Price Growth
Nominal growth measures the raw dollar increase without adjusting for inflation. Real growth adjusts for the declining purchasing power of money over time. The Reddit analysis estimated that Sydney homes were approximately
twice as expensive in real terms in 2026 as they were in 2003, a doubling in 22 years. That's meaningful, but it's far less dramatic than the nominal 8,000% headline. For property investors, this distinction matters when comparing property returns with other asset classes. Australian equities delivered similar real returns over the same period, with higher liquidity and lower transaction costs. Property's advantage lies in the ability to borrow against it (equity access), tax benefits (negative gearing, capital gains discount), and the psychological stability of a tangible asset. The sydney australia average house price has outpaced inflation over the long run, but it has not been a one-way wealth escalator.
How Does Sydney Compare With Other Australian Capital Cities?
Sydney consistently ranks as Australia's most expensive capital city, but the gap has narrowed in recent years as interstate migration and remote work reshaped demand. According to Statista, Sydney's median residential property value of
$1.19 million in December 2024 was approximately
25% higher than Melbourne (around $950,000),
50% higher than Brisbane (around $790,000), and
60% higher than Adelaide (around $740,000). Perth, Hobart, Canberra, and Darwin all sat below $900,000. These figures blend houses and units, so a direct house-only comparison would show an even wider Sydney premium. The gap reflects Sydney's role as Australia's largest employment market, its harbour geography that constrains land supply, and decades of underbuilding relative to population growth.
Why Sydney Commands a Premium
Sydney's price premium is structural, not speculative. The city accounts for roughly
20% of Australia's GDP and hosts the headquarters of most ASX-listed companies, creating concentrated high-income employment. The harbour, national parks, and coastal geography limit developable land, pushing density into established suburbs where rezoning is politically contentious. Infrastructure investment, the Metro rail network, WestConnex motorway, Western Sydney Airport, has improved connectivity but also increased land values in beneficiary corridors. For property investors, the sydney australia average house price premium means lower rental yields (2.5-3.5% gross versus 4-5% in Brisbane or Adelaide) but historically stronger capital growth. A $1.35 million Sydney house generating $700/week rent yields 2.7%. A $700,000 Brisbane house generating $550/week yields 4.1%. The trade-off is growth: Sydney delivered approximately
6-7% annual capital growth over the past two decades, compared with 5-6% in Brisbane and Melbourne.
Interstate Migration and Price Convergence
The pandemic accelerated a trend that had been building for years: Sydneysiders moving to more affordable capitals. Data from the ABS showed
net interstate migration out of New South Wales in 2020-2022, with Queensland and South Australia the primary beneficiaries. This migration reduced upward pressure on the sydney australia average house price while accelerating growth in Brisbane, the Gold Coast, and Adelaide. By 2026, the gap between Sydney and Brisbane had narrowed from 70% to approximately 50%. For investors, this convergence creates a strategic question: is Sydney's premium justified by fundamentals, or has it overshot? The answer depends on your investment horizon. Over 10-20 years, Sydney's employment concentration and supply constraints support continued premium pricing. Over 3-5 years, interstate markets may deliver stronger percentage returns from a lower base.
| City | Median Dwelling Value (Dec 2024) | Premium vs Brisbane |
|---|
| Sydney | $1.19 million | +50% |
| Melbourne | $950,000 | +20% |
| Brisbane | $790,000 | Baseline |
| Adelaide | $740,000 | -6% |
| Perth | $820,000 | +4% |
What Drives the Sydney Australia Average House Price?
Property prices are determined by the intersection of supply and demand, filtered through the cost and availability of credit. In Sydney, demand is driven by population growth (immigration, interstate migration, natural increase), employment concentration, and investor activity. Supply is constrained by land scarcity, planning regulations, construction costs, and the time lag between approval and completion. Credit conditions, interest rates, lending standards, borrowing capacity, determine how much buyers can pay. When the Reserve Bank of Australia cut rates to 0.1% in 2020-2021, borrowing capacity surged and the sydney australia average house price jumped 25% in 18 months. When rates rose to 4.35% in 2023-2024, price growth stalled as serviceability tightened.
Interest Rates and Borrowing Capacity
Interest rates are the single most powerful short-term driver of property prices. A 1% change in the cash rate translates to roughly a 10-15% change in borrowing capacity for a typical buyer. When the RBA raised rates by 4 percentage points between May 2022 and November 2023, a buyer who could previously borrow $1 million saw their capacity fall to approximately $850,000. That reduction flows directly into lower prices, or at least slower growth, because fewer buyers can compete at the previous price level. For investors, this relationship creates opportunity. Rising rates suppress prices and improve entry points. Falling rates inflate prices but improve cashflow (lower repayments). The sydney australia average house price tends to move inversely with the cash rate over 12-24 month periods, though long-term growth is driven by fundamentals rather than monetary policy.
Supply Constraints and Planning Policy
Sydney has chronically underbuilt relative to population growth for more than two decades. The NSW government's housing targets call for 75,000 new homes per year, but actual completions have averaged 40,000-50,000. The shortfall accumulates into a structural deficit that supports price growth even during periods of weak demand. Planning restrictions, heritage overlays, height limits, minimum lot sizes, council opposition to density, prevent the market from responding to price signals. A suburb where land is worth $2,000 per square metre should attract developers, but if zoning permits only one dwelling per 600 square metres, the supply response is muted. For buyers, this means the sydney australia average house price is unlikely to fall substantially in real terms over the long run unless planning policy changes dramatically. For investors, it means Sydney's supply-demand imbalance is structural, not cyclical.
If you're serious about building wealth through property in a supply-constrained market like Sydney, understanding how to structure your portfolio around cashflow and equity is essential.
Book a strategy call to see how dual-key and triple-key properties can deliver the yields Sydney houses cannot.
Ready to take the next step with Somerstone Property Group? The Sydney median house price has continued to climb through 2025-2026, reflecting the structural supply constraints and employment concentration that underpin the city's premium. Investors comparing capital city returns should note that the Perth median house price has tracked a different cycle, with strong recent growth after years of underperformance.
Our team is ready to help you achieve your goals. Book a discovery call. Understanding how Sydney's long-term performance fits within the broader context of average return on property investment across Australia helps investors set realistic expectations for capital growth and yield.
How Do Sydney Suburbs Vary in Price?
The sydney australia average house price is a useful benchmark, but it obscures enormous variation across suburbs. Median house prices range from under $700,000 in parts of Western Sydney to over $7 million in harbourside enclaves. According to Domain's September 2025 data, the most expensive suburbs, Point Piper, Vaucluse, Bellevue Hill, Mosman, had median house prices exceeding $5 million. Middle-ring suburbs like Strathfield, Epping, and Ryde sat near the city median of $1.35 million. Outer suburbs in the Blacktown, Penrith, and Campbelltown local government areas ranged from $700,000 to $950,000. For investors, this variation creates strategic choice: buy in established, high-growth areas with low yields, or buy in affordable, high-yield areas with uncertain growth.
Premium Suburbs: Capital Growth Over Cashflow
Sydney's premium suburbs deliver the strongest long-term capital growth but the weakest rental yields. A $5 million house in Mosman might rent for $2,500/week, generating a gross yield of 2.6%. The same $5 million invested in five properties in Western Sydney could generate $3,500-$4,000/week combined, yielding 3.6-4.2%. The trade-off is growth: Mosman has appreciated approximately 8-9% annually over the past 20 years, while Western Sydney has averaged 5-6%. For high-net-worth investors with strong cashflow from other sources, premium suburbs offer tax-effective wealth accumulation through capital gains. For investors building a portfolio, the low yields and high entry prices make premium suburbs difficult to scale. The sydney australia average house price sits between these extremes, representing middle-ring suburbs where growth and yield are more balanced.
Affordable Suburbs: Yield and Accessibility
Western Sydney suburbs like Mount Druitt, Tregear, Blacktown, and Campbelltown offer entry prices 40-50% below the city median. A $750,000 house in these areas might rent for $550-$600/week, yielding 3.8-4.2% gross. The higher yield improves cashflow and serviceability, making it easier to hold the property and borrow for the next one. The risk is weaker capital growth, these suburbs have historically lagged the city average by 1-2% annually. Infrastructure investment is changing the equation: the Western Sydney Airport, Metro rail extensions, and rezoning around growth centres are expected to drive above-average growth in the 2025-2035 period. For investors, the sydney australia average house price in affordable suburbs represents a calculated trade-off: accept lower current value in exchange for higher income and potential infrastructure-driven growth.
What Does the Sydney Australia Average House Price Mean for Buyers and Investors?
For first-home buyers, the sydney australia average house price of $1.35 million is a confronting figure. With a 20% deposit, that's $270,000 in savings plus $30,000-$40,000 in stamp duty and acquisition costs, roughly $310,000 total. On a household income of $150,000, saving that amount takes 5-7 years of disciplined budgeting. Even with the deposit, serviceability is tight: a $1.08 million loan at 6.5% costs approximately $7,000/month, or 56% of gross income. Lenders typically cap repayments at 30-35% of net income, so many first-home buyers are priced out of the median house market entirely. The alternative is buying a unit (median $780,000), buying in an outer suburb, or renting in Sydney while investing elsewhere, a strategy known as rentvesting.
Affordability and Income Multiples
The ratio of median house price to median household income is a common affordability measure. In Sydney, the median house price of $1.35 million divided by median household income of approximately $120,000 gives a ratio of
11.3 times. Historically, ratios above 5-6 times are considered severely unaffordable. Sydney's ratio has been above 10 times for most of the past decade, making it one of the least affordable cities globally. For comparison, Brisbane's ratio is approximately 8 times, Melbourne's is 10 times, and Adelaide's is 7 times. The high ratio means first-home buyers in Sydney face a structural affordability challenge that cannot be solved by saving harder or earning more, the price-to-income gap is too wide. The sydney australia average house price would need to fall 40% or incomes would need to rise 80% to restore historical affordability ratios.
Investment Strategy in a High-Price Market
For property investors, Sydney's high prices and low yields create a strategic dilemma. A $1.35 million house yielding 2.7% generates $36,450 annual rent, or $3,038/month. The mortgage on a 90% LVR loan at 6.5% costs approximately $7,700/month. Add rates, insurance, management, and maintenance, and the property costs the investor $5,000-$5,500/month out of pocket. That's $60,000-$66,000 per year in negative cashflow. Over 10 years, the cumulative cost is $600,000-$660,000 before tax deductions. The investment only makes sense if capital growth exceeds the holding cost, and that requires either strong income to sustain the cashflow drain or a different property structure. This is why Somerstone's dual-key and triple-key strategies focus on high-yield, positive-cashflow properties outside Sydney's premium markets. The sydney australia average house price is too high and the yield too low for most investors to build a multi-property portfolio using traditional single-income houses.
The Bottom Line
The sydney australia average house price in 2026 sits at approximately $1.35 million for detached houses and $1.19 million for all dwellings, making Sydney Australia's most expensive capital city. Prices have risen 8,000% since 1970 in nominal terms, though inflation-adjusted growth is more modest at roughly 5.7 times. The market is driven by supply constraints, employment concentration, and credit conditions, with meaningful variation across suburbs. For first-home buyers, affordability is a structural challenge. For investors, the low yields and high entry prices demand a strategic approach that prioritises cashflow and equity access over speculative capital growth.
Frequently Asked Questions
What is the sydney australia average house price in 2026?
The median house price in Sydney is approximately $1.35 million as of September 2025, based on Domain data. The median dwelling value (including units) is around $1.19 million. Prices vary substantially by suburb and property type. The mechanics of how property price is determined apply universally, but Sydney's unique supply and demand dynamics amplify the impact of each driver.
Why is the sydney australia average house price so high compared with other cities?
Sydney's high prices reflect land scarcity, strong employment concentration, chronic housing undersupply, and infrastructure investment. The city accounts for 20% of Australia's GDP and has limited developable land due to geography and planning restrictions.
How much deposit do I need to buy a house at Sydney's median price?
A 20% deposit on a $1.35 million house is $270,000, plus approximately $40,000 in stamp duty and costs, totaling $310,000. First-home buyers can access schemes with lower deposits, but lenders mortgage insurance applies below 20%.
Can I build a property portfolio starting in Sydney's market?
Building a portfolio in Sydney is challenging due to low rental yields (2.5-3.5%) and high entry prices. Most investors start with high-yield properties in Brisbane, regional Victoria, or Queensland, then add Sydney later once equity and cashflow support it.
What does it take to own a self-sufficient property in Sydney?
A self-sufficient property requires rental income that covers mortgage, rates, insurance, and management. In Sydney, this typically means dual-key or multi-income structures, or buying in outer suburbs where yields exceed 4%. Single-income houses rarely achieve this.