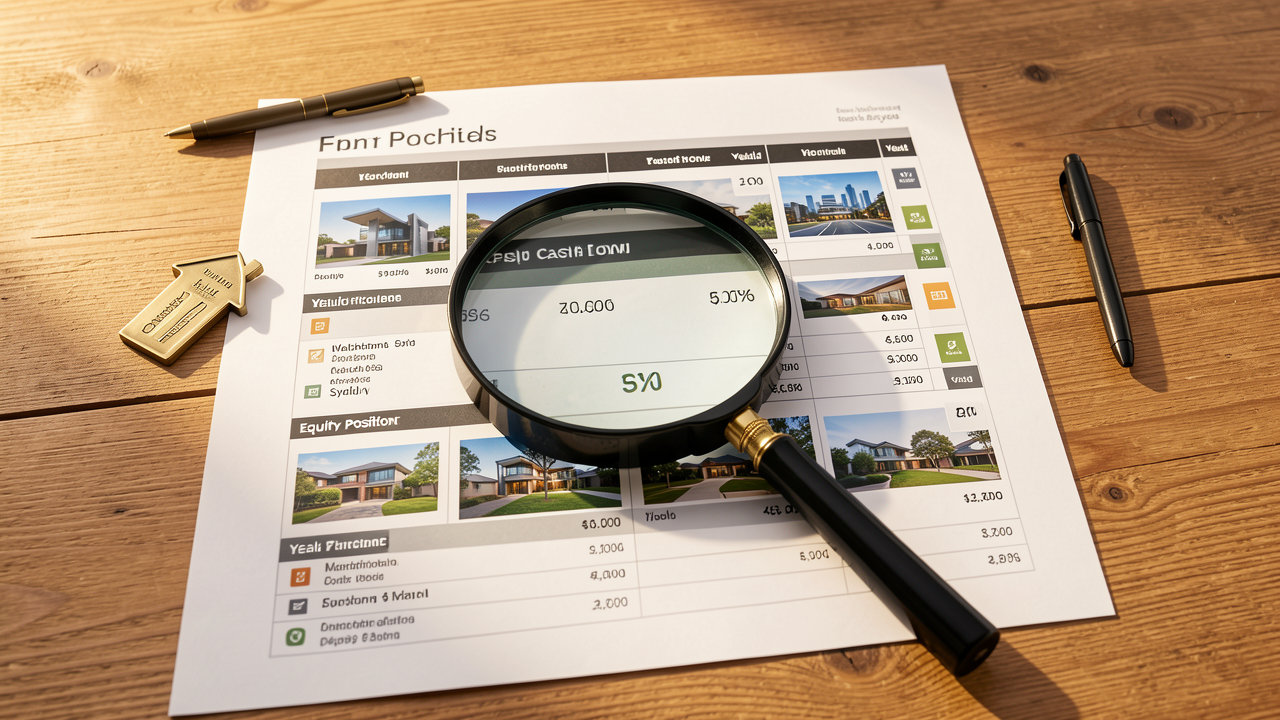
The short answer: A property investment portfolio template is a structured tracking system that consolidates purchase details, cashflow metrics, equity positions, and performance data across multiple investment properties. It transforms scattered information into actionable insights, enabling you to measure returns, identify underperformers, and make confident acquisition decisions. The right template saves hours of manual calculation and prevents costly strategic errors. Many investors using structured portfolio templates are simultaneously pursuing rentvesting strategies, where tracking becomes essential to compare the financial performance of owned investment properties against the lifestyle flexibility of renting where they actually live.
Most property investors track their portfolio in their head or across fragmented spreadsheets until the day they can't remember which property is costing them money. By then, they've already made expensive mistakes, overleveraging on a poor performer, missing refinance opportunities, or buying property four without understanding how properties one through three affect their borrowing capacity.
A property investment portfolio template eliminates that chaos. It's the difference between guessing and knowing. When you can see every property's cashflow, equity position, and yield performance in one place, you make better decisions faster. Research from the Australian Taxation Office shows investors with three or more properties are twice as likely to use structured tracking systems compared to single-property owners, because complexity demands clarity.
This article breaks down what makes a portfolio template genuinely useful, which metrics matter most for Australian investors, and how to build or adapt a system that grows with your portfolio. You'll see why a spreadsheet built for US fix-and-flip investors won't work for dual-key cashflow strategies, and what to track if you're building wealth through equity recycling rather than speculative flips.
The best property investment portfolio template doesn't just list your properties, it answers the questions that determine whether you're building wealth or burning it. Can you service another loan? Which property should you refinance first? Is your portfolio positively cashflowed overall or are you subsidising losses without realising it?
Most templates fail because they track the wrong things. They focus on purchase price and current valuation, backward-looking data, while ignoring the forward-looking metrics that shape your next move. A useful template tracks acquisition details, ongoing performance, and strategic capacity simultaneously.
Every property investment portfolio template must capture the foundational data: property address, purchase date, purchase price, stamp duty and acquisition costs, loan amount and lender, interest rate and loan type (fixed, variable, interest-only, principal-and-interest), and settlement date. These aren't just record-keeping fields, they're the inputs for every subsequent calculation.
For Australian investors, capturing depreciation schedule details is critical. A dual-key property purchased for $550,000 might generate $18,000 in first-year depreciation deductions. That's real tax savings of $6,660 at a 37% marginal rate. Your template should track Division 43 (capital works) and Division 40 (plant and equipment) separately, along with the quantity surveyor report date and total claimable depreciation over the current financial year.
Purchase structure matters too. Is the property held in your personal name, a trust, or an SMSF? The ownership structure affects tax treatment, borrowing capacity, and exit strategy. According to CoreLogic's 2024 Investor Insights Report, 23% of Australian investment properties are held in discretionary trusts, yet most templates don't include a field for entity structure. That's a blind spot that complicates portfolio-wide analysis when you're trying to model tax outcomes across different ownership vehicles.
This is where a property investment portfolio template earns its keep. Monthly rental income (broken out by tenancy if it's a dual-key or triple-key property), mortgage repayment amount, council rates, water rates, insurance premiums, property management fees (typically 7-9% of rent plus GST), strata fees (if applicable), maintenance allowance (industry standard is 1% of property value annually), and net cashflow (rental income minus all holding costs). The net cashflow figure tells you whether the property is positively geared, negatively geared, or cash neutral, the single most important metric for portfolio serviceability.
A 2024 study by Mortgage Choice found that investors with positive cashflow properties could acquire their next investment 18 months faster on average than those with negatively geared portfolios, because the rental income improved rather than constrained borrowing capacity. Your property investment portfolio template should calculate this automatically, if you're manually adding up expenses every month, you're wasting time and increasing error risk.
Yield metrics matter equally. Gross rental yield is annual rent divided by purchase price, expressed as a percentage. Net rental yield accounts for all holding costs. A property generating $32,000 annual rent on a $500,000 purchase price has a 6.4% gross yield, but if holding costs are $12,000 annually, the net yield drops to 4%. Both numbers belong in your template because they serve different purposes: gross yield helps compare properties, net yield tells you what you're actually earning.
| Metric | What it measures | Why it matters |
|---|---|---|
| Net cashflow | Monthly rent minus all costs | Determines borrowing capacity for next purchase |
| Gross rental yield | Annual rent ÷ purchase price | Compares income performance across properties |
| Usable equity | 80% LVR minus loan balance | Shows available deposit for next acquisition |
| Depreciation claimed | Annual tax deduction amount | Reduces taxable income and effective holding cost |
Equity is the engine of portfolio growth, yet most property investment portfolio templates treat it as a static number. They show current property value minus loan balance and call it done. That's not equity, that's a snapshot. What you need is usable equity, the amount you can actually access to fund the next purchase without triggering lender mortgage insurance or breaching loan-to-value ratio limits. Before committing to a multi-property tracking system, some investors first wrestle with the fundamental question of property vs diversified portfolio allocation, which determines whether concentrated property tracking is even the right wealth-building approach for their circumstances.
Understanding equity positioning transforms a basic tracking spreadsheet into a strategic planning tool. When you can see how much equity is available across your entire portfolio, and which properties offer the best refinance opportunities, you stop guessing about when you can buy next and start planning it.
Usable equity is calculated as 80% of the property's current market value minus the outstanding loan balance. Lenders typically allow borrowing up to 80% loan-to-value ratio without mortgage insurance, so that's your accessible ceiling. A property worth $700,000 with a $450,000 loan has $110,000 in usable equity: (700,000 × 0.80), 450,000 = 110,000.
Your property investment portfolio template should calculate this automatically for every property and sum the total across your portfolio. That total usable equity figure is your available deposit pool for the next acquisition. According to the Australian Bureau of Statistics 2024 Housing Finance data, the median deposit for investment property purchases was $140,000, meaning a portfolio with $150,000+ in combined usable equity is positioned for the next move.
The calculation gets more sophisticated when you factor in equity growth over time. Property values don't sit still. If you purchased a property three years ago and haven't updated the valuation in your template, your equity figure is fiction. Use recent comparable sales data or order a formal valuation every 12-24 months. A property that's appreciated 15% since purchase might have unlocked an additional $75,000 in usable equity, but only if you know the current value.
Tracking equity property-by-property is useful. Tracking it portfolio-wide is strategic. When you can see the combined usable equity across all properties, you can model different refinance scenarios. Should you refinance property one to access $80,000 and buy property four? Or refinance properties two and three together to access $140,000 and buy two smaller properties?
This is where a property investment portfolio template becomes a planning instrument, not just a record. Include a section that models equity release scenarios: current combined usable equity, estimated refinance costs (typically $3,000-$5,000 per property for valuation, legal, and lender fees), net equity available after costs, and deposit requirement for target purchase price range. When you can see these numbers side by side, you make refinance decisions based on strategy rather than reacting to a broker's recommendation.
Data from the Reserve Bank of Australia's 2024 Financial Stability Review shows that investors who refinance to access equity within 24-36 months of purchase build portfolios 40% faster than those who wait five years or more, because they capture equity growth while maintaining strong serviceability. Your template should flag properties that have been held for 24+ months and have appreciated 10%+ as refinance candidates.
You'll find dozens of property investment portfolio templates online, some free, some paid, some designed for US fix-and-flip strategies that don't translate to Australian buy-and-hold investing. The question isn't whether templates exist. It's whether the available options fit your strategy or whether you need to build something custom.
The answer depends on portfolio complexity and strategic sophistication. A single-property investor tracking one house can use a basic spreadsheet. An investor building a dual-key portfolio across three states with SMSF and personal ownership structures needs something far more strong.
Pre-built property investment portfolio templates save time if your portfolio is straightforward and your strategy aligns with the template's assumptions. Marketplace platforms offer templates designed for landlords managing multiple tenancies, investors tracking cashflow and yield, and developers monitoring project-based returns. These work well when you're starting out or when your portfolio fits a standard structure.
A typical pre-built template includes fields for property address, purchase details, loan information, rental income, and basic expense categories. More sophisticated versions add depreciation tracking, equity calculations, and yield metrics. The best pre-built templates use formulas that auto-calculate net cashflow, gross yield, and usable equity as you enter data, eliminating manual math errors.
The limitation is flexibility. Pre-built templates assume a certain portfolio structure. If you're investing in dual-key properties with two separate rental incomes per property, many templates don't accommodate that without customisation. If you're tracking SMSF properties separately from personal holdings, you'll need workarounds. According to a 2024 survey by Your Investment Property Magazine, 62% of investors using pre-built templates reported needing meaningful modifications within the first year to match their actual portfolio structure.
Building a custom property investment portfolio template makes sense when your strategy is sophisticated, your portfolio is growing, or you need integration with other financial planning tools. Custom templates can be built in Excel or Google Sheets with formulas tailored to your exact metrics, or in database tools for more complex portfolios with dozens of properties. The metrics you track in your template should directly support the acquisition principles outlined in building a smart property investment portfolio, where strategic selection criteria determine which properties enter your tracking system in the first place.
Custom builds allow you to track exactly what matters to your strategy. Dual-key investors can create separate income columns for each tenancy. SMSF investors can build tax calculation fields specific to the 15% concessional rate. Investors using equity recycling can model refinance scenarios with custom formulas that factor in current LVR, projected appreciation, and refinance costs. The template becomes a strategic planning tool rather than a record-keeping exercise.
The trade-off is time and skill. Building a reliable custom template requires spreadsheet proficiency and a clear understanding of the metrics that drive your strategy. For investors managing five or more properties with complex structures, the investment is worthwhile. For those just starting, a pre-built option that you customise over time often makes more sense. Start simple, add complexity as your portfolio demands it.
Owning multiple properties doesn't automatically mean you're building wealth. Plenty of investors accumulate assets without improving their financial position, because they track the wrong metrics or don't track them at all. A property investment portfolio template that focuses solely on property values and loan balances misses the metrics that actually determine whether you're progressing or stagnating.
Wealth builders track performance differently. They measure cashflow contribution, equity velocity, tax efficiency, and portfolio serviceability, the metrics that reveal whether the portfolio is self-sustaining or whether it's draining resources faster than it's creating value.
Cashflow contribution is the net income or cost each property adds to your monthly budget. A property generating $2,800 in rent with $2,200 in holding costs contributes $600 positive cashflow. A property generating $1,800 in rent with $2,400 in holding costs costs you $600 per month. Your property investment portfolio template should sum these contributions across all properties to show your portfolio-wide cashflow position.
This number determines your borrowing capacity for the next purchase. Lenders assess serviceability by calculating your net income after all expenses, including investment property costs. Every dollar a property costs you per month reduces what you can borrow. Every dollar it contributes increases it. A 2024 analysis by Loan Market found that investors with portfolio-wide positive cashflow had 35% higher borrowing capacity on average than those with equivalent equity but negative cashflow portfolios.
Portfolio serviceability goes beyond individual properties. It's about whether the entire portfolio can sustain itself if one property sits vacant, if interest rates rise, or if unexpected maintenance costs hit. Your template should include a buffer analysis: total monthly rental income minus total monthly costs, expressed as a percentage. A 20% buffer means your portfolio can absorb a 20% income drop before you're subsidising from your own pocket. Anything below 10% is fragile.
Equity velocity measures how quickly your portfolio is building accessible equity, the fuel for the next acquisition. It's not just about property values increasing. It's about how fast that increase translates into usable equity you can deploy. A property that appreciates $50,000 in two years has built equity faster than one that appreciates $60,000 in five years, even though the absolute gain is higher on the second property.
Your property investment portfolio template should track annual capital growth per property and calculate the equity build rate: (current usable equity minus usable equity at purchase) divided by years held. This shows which properties are performing and which are lagging. If property one has built $40,000 in usable equity over two years while property two has built $15,000 over the same period, you know where your growth is coming from, and where it isn't.
Capital growth tracking also informs refinance timing. Properties that have appreciated 15-20% since purchase are strong refinance candidates because the equity release will be substantial relative to refinance costs. According to CoreLogic's 2024 Pain & Gain Report, Australian capital city properties appreciated an average of 8.2% annually over the past decade, but that average hides massive variation by location and property type. Your template should reveal which of your properties are outperforming that benchmark and which are underperforming.
For investors using Somerstone Property Group's portfolio construction approach, the template tracks how dual-key and triple-key properties contribute both cashflow and equity velocity simultaneously, combining high rental yields with exposure to growth markets. This dual-return structure accelerates portfolio building because you're not sacrificing one metric for the other. Investors who've read widely across property investment books often recognise that authors like Jan Somers and Michael Yardney emphasise systematic tracking as a non-negotiable habit, yet few books provide the actual template structure to implement their advice.
Ready to take the next step with Somerstone Property Group?
Our team is ready to help you achieve your goals. Book a discovery call.
Tax efficiency is one of the most overlooked dimensions in property investment portfolio templates, yet it directly affects your after-tax return. Two portfolios with identical gross yields and capital growth can deliver vastly different wealth outcomes depending on how effectively they use depreciation, negative gearing, and capital gains tax planning.
A sophisticated property investment portfolio template tracks not just income and expenses, but the tax implications of both. It shows how much taxable income each property generates or offsets, how depreciation deductions reduce your effective holding cost, and how CGT liability will impact your exit strategy when you eventually sell.
Depreciation is a non-cash deduction that reduces taxable income without requiring any money to leave your account. For new-build investment properties, first-year depreciation can be $15,000-$25,000 depending on construction cost and inclusions. On a 37% marginal tax rate, that's $5,550-$9,250 in tax savings. Your property investment portfolio template should track annual depreciation per property and calculate the cumulative tax benefit over time.
Break depreciation into Division 43 (capital works, 2.5% annually over 40 years) and Division 40 (plant and equipment, varying rates based on effective life). A dual-key property with $350,000 in construction cost generates $8,750 annually in Division 43 depreciation alone. Add Division 40 items, carpet, blinds, appliances, air conditioning, and the total often reaches $12,000-$18,000 in year one, declining gradually as plant and equipment items fully depreciate.
The Australian Taxation Office's 2024 Taxation Statistics show that property investors who claim depreciation deductions have 22% lower effective tax rates on investment income compared to those who don't. Yet many investors don't track depreciation in their portfolio template, treating it as a once-a-year accountant task rather than an ongoing strategic input. Include depreciation as a line item in your monthly cashflow calculation, it reduces your after-tax holding cost and should be visible in your performance metrics.
Negative gearing allows you to offset investment property losses against other income, reducing your overall taxable income. A property costing $3,000 more per year to hold than it generates in rent creates a $3,000 tax deduction. On a $120,000 salary at a 37% marginal rate, that deduction saves $1,110 in tax. Your property investment portfolio template should calculate the portfolio-wide negative gearing benefit: total rental income minus total deductible expenses (including depreciation), multiplied by your marginal tax rate.
The critical insight is whether negative gearing is a strategy or a symptom. If you're deliberately using negative gearing to reduce tax while building equity, that's a conscious choice. If you're negatively geared because you bought poor-yielding properties and didn't realise it until tax time, that's a problem. Your template should flag properties with net losses exceeding 20% of rental income, these are candidates for review, refinance, or sale.
Portfolio-wide tax position matters when planning the next acquisition. Adding another negatively geared property increases your tax deductions but also reduces your serviceability for future borrowing. Adding a positively cashflowed property improves serviceability and still delivers depreciation benefits. The property investment portfolio template should model both scenarios so you can see the trade-off before committing to the next purchase.
Building a property investment portfolio template is the easy part. Keeping it accurate and useful over years is where most investors fail. Spreadsheets fill with outdated valuations, rental figures that haven't been updated in 18 months, and expense estimates that no longer reflect reality. A template that isn't maintained is worse than no template, it creates false confidence based on bad data.
Long-term maintenance requires discipline and systems. You need a regular update cadence, a process for capturing new data as it comes in, and periodic reviews to ensure the template still serves your evolving strategy. The goal is a living document that reflects your portfolio's current state, not a historical record that's three years out of date.
The minimum viable maintenance routine is monthly data entry and quarterly performance reviews. Monthly updates capture rental income received, expenses paid, loan balance changes (if you're making principal repayments), and any one-off costs like maintenance or repairs. This takes 15-20 minutes per property if your template is well-structured and you're pulling data directly from bank statements and property management reports.
Quarterly reviews go deeper. Update property valuations using recent comparable sales data or online valuation tools. Recalculate usable equity based on current values and loan balances. Review cashflow trends, is net cashflow improving or deteriorating? Are any properties consistently underperforming? Check whether your portfolio-wide metrics (total equity, total cashflow, average yield) are tracking toward your 12-month goals. Investors tracking Western Australia investment property alongside eastern states holdings need templates that accommodate regional yield variations, where Perth properties might show 5.2% gross yields compared to Sydney's 3.1%, fundamentally changing portfolio-wide cashflow calculations.
According to a 2024 study by the Property Investment Professionals of Australia, investors who conduct quarterly portfolio reviews identify underperforming assets 18 months earlier on average than those who review annually or less frequently. That earlier identification means faster corrective action, whether that's increasing rent, refinancing, or selling, and less wealth leakage over time.
At least once per year, update your property investment portfolio template with formal or bank-grade valuations. Property values change. Markets move. A property you purchased for $500,000 three years ago might be worth $580,000 today, or $490,000 if the local market softened. Using outdated valuations in your equity calculations leads to bad refinance decisions and inaccurate borrowing capacity estimates.
Annual reviews are also the time to recalibrate strategy. Is your portfolio delivering the outcomes you expected? If you modelled 6% gross yields and you're averaging 5.2%, why? Are rents below market, or did you overestimate income at purchase? If you projected $150,000 in usable equity by now and you're at $110,000, what changed, slower appreciation, higher loan balances, or both?
Use the annual review to update your 10-year acquisition roadmap. If your goal is six properties and you're currently at three, does your equity position and borrowing capacity support acquiring property four in the next 12-18 months? If not, what needs to change, pay down debt faster, improve rental yields, or wait for further appreciation? The property investment portfolio template should inform these decisions with data, not gut feel.
A property investment portfolio template is only as valuable as the decisions it enables. The right template transforms scattered data into strategic clarity, showing you which properties are performing, where your equity is building, and whether your portfolio is self-sustaining or draining resources. It answers the questions that matter: can you afford the next purchase, which property should you refinance first, and is your portfolio on track to deliver your 10-year wealth goals?
The best templates track more than property values and loan balances. They measure cashflow contribution, usable equity, depreciation benefits, and portfolio-wide serviceability. They're updated regularly, maintained with discipline, and used as planning tools rather than historical records. Whether you build custom or adapt a pre-built option, the template must fit your strategy, dual-key yields, SMSF structures, equity recycling, whatever framework drives your wealth building.
Start with the metrics that matter most to your current portfolio stage. If you're at one or two properties, focus on cashflow and equity position. If you're building toward five or more, add portfolio serviceability and tax efficiency tracking. The template should grow with your portfolio, not constrain it. Clarity before capital, know where you stand before you make the next move.
At minimum, track property address, purchase price and date, current loan balance and interest rate, monthly rental income, monthly holding costs (mortgage, rates, insurance, management fees), net cashflow, current property valuation, and usable equity. These six data points enable basic performance assessment and refinance planning.
Update rental income and expenses monthly, review cashflow and performance quarterly, and refresh property valuations annually. Monthly updates take 15-20 minutes per property. Quarterly reviews identify trends early. Annual valuations ensure equity calculations reflect current market conditions, not outdated purchase prices.
Yes, but separate them clearly. SMSF properties have different tax treatment (15% on rental income, 10% on capital gains after 12 months) and regulatory requirements. Use separate tabs or sections within your property investment portfolio template, and ensure tax calculations reflect the correct entity structure for each property.
Gross yield is annual rent divided by purchase price, ignoring expenses. Net yield subtracts all holding costs (mortgage, rates, insurance, management, maintenance) before dividing by purchase price. Gross yield helps compare properties. Net yield shows actual return after costs, the number that matters for wealth building.
A useful template answers strategic questions: can I afford the next property, which asset should I refinance first, is my portfolio self-sustaining? If your template only records past transactions without informing future decisions, it's a record-keeper, not a planning tool. Measure utility by whether it changes your actions.
